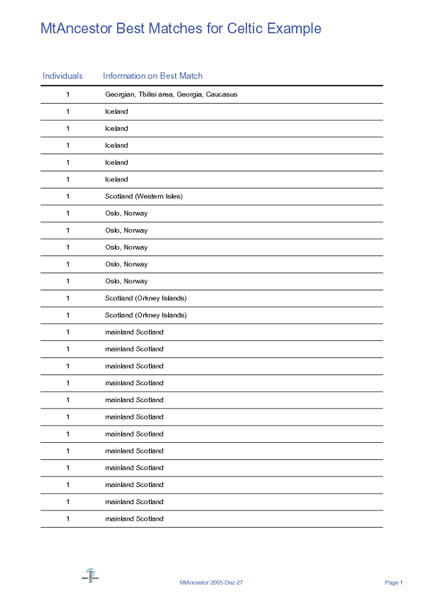
In this example, an individual of British ancestry has had his DNA tested and compared with our database. Our database then automatically compiled a list of best genetic matches which you can see on the right. These genetic matches are his closest maternal genetic cousins in the worldwide database.
To show you where your genetic cousins are located, we provide you with geographic coordinates and a world map displaying your genetic matches.
This particular client is of British/Irish ancestry and our database has found several matches with volunteers from scientific publications.
We will guide you to relevant scientific papers describing your matches where, ideally, you can read more about you distant cousins and the population history connecting you with them.
In the given example, we would guide the client to the publications by Helgason et al. (2001), McEvoy et al (2004) and Forster et al. (2004) which describe the relevant matches and provide a scientific interpretation.
These three papers are based on volunteers who were analysed in scientific studies on the origins of the British and Irish populations.
As you can see in the example output, this client has a particular J lineage which is found nearly exclusively in historically Celtic-speaking areas of Ireland, Scotland, Cornwall and Wales.
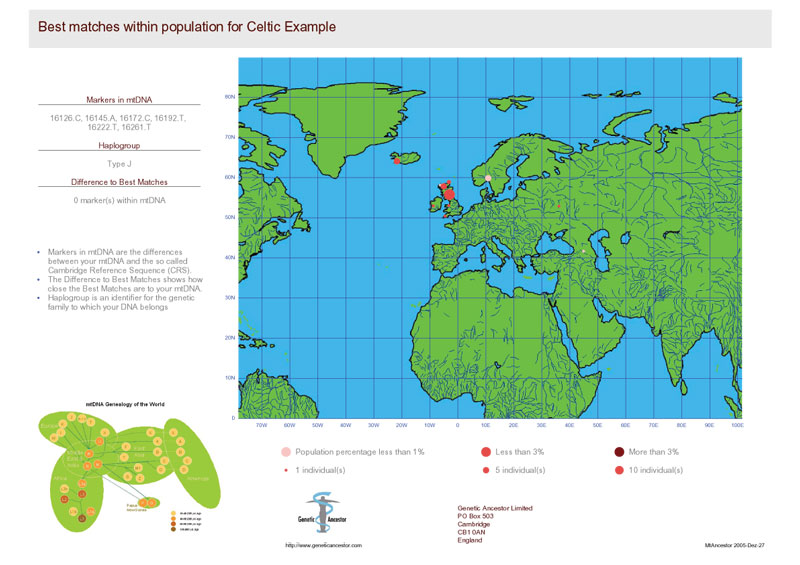
According to the publications, this J lineage appears to be a marker for the arrival of Celtic-speakers to the British Isles several thousand years ago.
Note also the presence of this J type in modern Icelanders and Norwegians – the papers will tell you that this is believed to be the result of Norwegian Viking raids in Scotland and Ireland, whereby women would have been abducted and taken to Norway and Iceland, such that a substantial proportion of Icelandic maternal lineages today derive from the British Isles.
Furthermore, the map shows two isolated matches in eastern Europe – the papers explain that these are probably the result of independent or ancient mutations which are not linked to British prehistory.
-
McEvoy B, Richards M, Forster P, Bradley DG (2004) The longue durée of genetic ancestry: multiple genetic marker systems and Celtic origins on the Atlantic façade of Europe. Am J Hum Genet:693-702
-
Forster P, Romano V, Calì F, Röhl A, Hurles M (2004) MtDNA markers for Celtic and Germanic language areas in the British Isles. In: Traces of Ancestry: Studies in Honour of Colin Renfrew. Edited by Martin Jones, McDonald Institute Press, University of Cambridge, pp99-111
-
Helgason A, Hickey E, Goodacre S, Bosnes V, Stefansson K, Ward R, Sykes B (2001) mtDNA and the islands of the North Atlantic: estimating the proportions of Norse and Gaelic ancestry. Am J Hum Genet 68:723-737
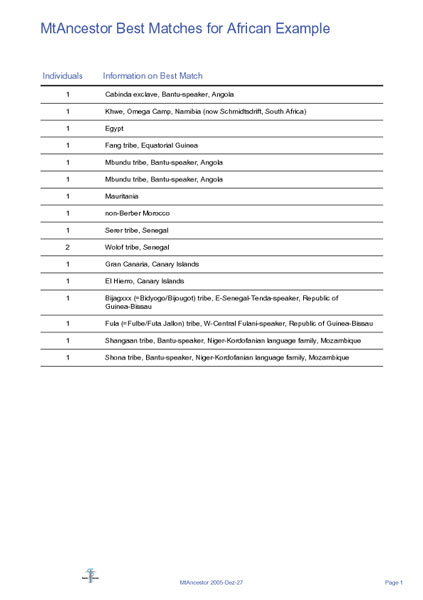
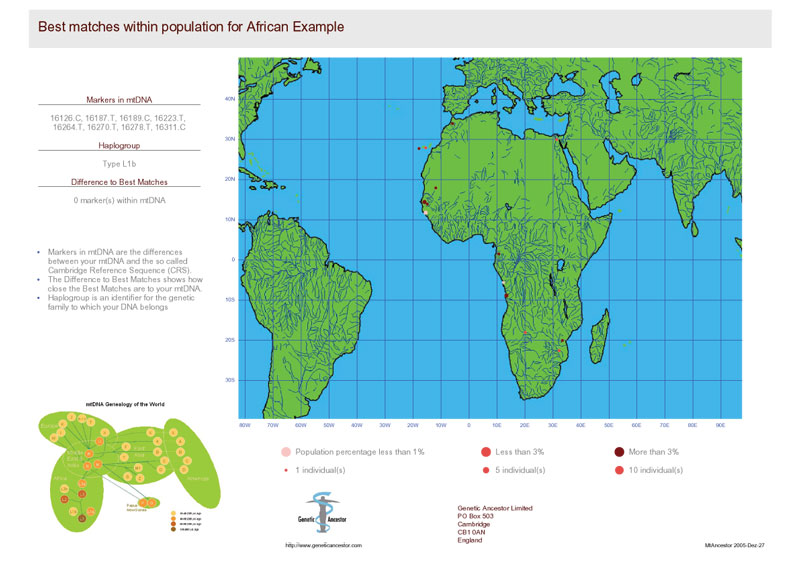
On the right you can see the results for a typical west African man with an L1b maternal lineage.
His specific mtDNA type has remained unchanged by mutation for more than 10,000 years, and has therefore had plenty of time to travel: his closest matches are now found over a wide area of western Africa south of the Sahara Desert, and even occasionally north of the Sahara Desert.
This distribution confirms that his mtDNA is older than the Sahara Desert itself, which was green and relatively lush a few thousand years ago, making it much simpler for our stone age ancestors to cross from south to north.
The list gives additional details on the maternal genetic matches for this man.
In particular, this list explains the tribal and/or linguistic affiliations for each match, and we will provide guidance on how to access the original scientific studies on these tribes.
Worldwide centre-of-gravity (COG) analysis of Icelandic mtDNA.
Icelandic COGs with high geographic specificity (standard deviation <400 km) were found mainly in Europe (in the British Isles and in Norway).
To generate this plot, Icelandic mtDNA was deleted from the data base, and then closest genetic matches to 447 Icelandic mtDNAs were searched in the rest of the world.
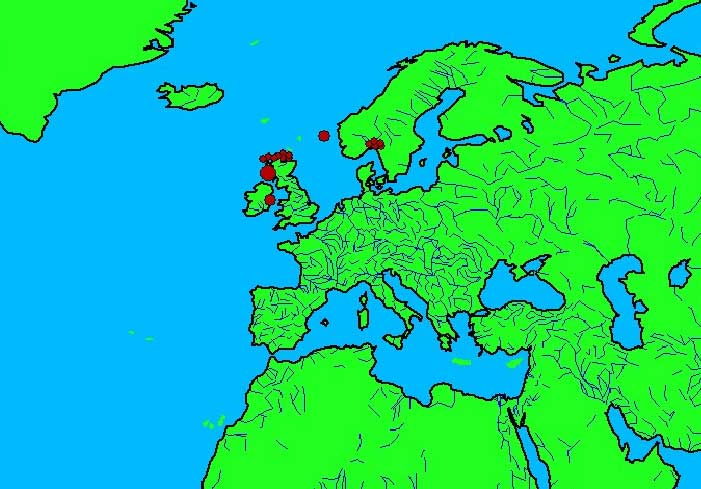
COGs were calculated from these matches, and the most specific COGs (standard deviation <400 km) are displayed in dark color on the map.
COGs are calculated as in P. Forster et al. (2002), and are based on at least two closest matches in the database.
The clustering of Norwegian COGs exclusively in Oslo reflects the fact that other parts of Norway have hardly been sampled to date, apart from Norwegian Saami.